
What the latest housing numbers tell us as we head toward fall
Key Insights: More Choices, Strong Prices & Fast-Moving Homes
As we head into September, the latest complete Lancaster County real estate statistics give us an interesting look at where the market stands heading toward fall. The most recent data, from July, shows more homes coming to market, prices holding strong, and desirable properties selling faster—a combination that creates opportunities for both buyers and sellers.
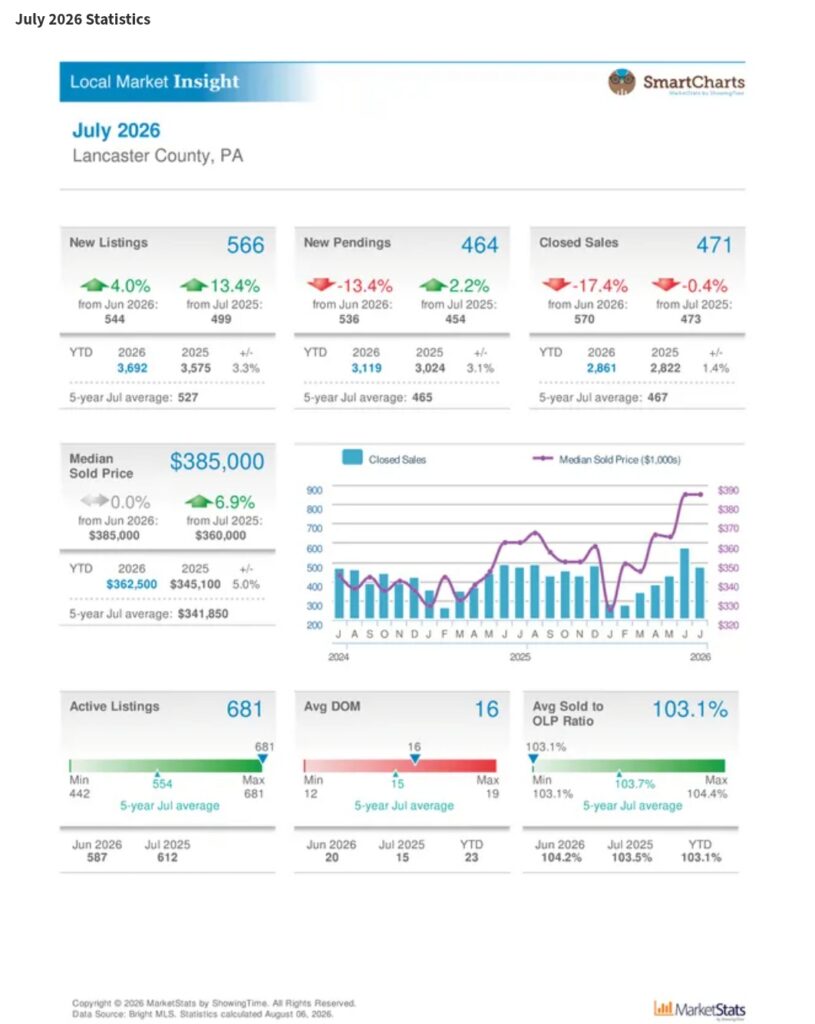
July brought 566 new listings, up 13.4% from the previous year, while the median sold price held at $385,000, a 6.9% increase over July 2025. Homes sold in an average of just 16 days, and sellers received an average of 103.1% of their original list price. So while buyers are finally seeing more choices, well-positioned homes are clearly still commanding attention.
What the Latest Numbers Can Tell Us About This Fall
The most interesting part of this market isn’t one individual statistic. It’s what happens when we put them together.
Active inventory reached 681 homes in July, compared with 587 in June and 612 in July 2025. That’s also well above the five-year July average of 554.
For buyers, that’s encouraging. More inventory means more choices, and after years of extremely tight selection, even a little breathing room can make the home search feel different.
But sellers shouldn’t mistake rising inventory for disappearing demand.
Homes actually sold faster in July, averaging only 16 days on market compared with 20 in June. Sellers also averaged 103.1% of original list price.
That’s what makes our current Lancaster County market so interesting.
Buyers have more choices—but they’re still moving quickly when they find the right home.
The Market Is Changing—and That’s Not Necessarily a Bad Thing
Real estate headlines tend to make everything sound very black and white.
“It’s a seller’s market.”
“It’s a buyer’s market.”
“Prices are going up.”
“Inventory is increasing.”
But when you’re actually thinking about buying or selling a home, those headlines don’t tell you nearly enough.
A seller might hear that homes averaged 103.1% of asking price and think, Great, I can put any price on my house.
Not quite.
A buyer might see a $385,000 median sales price and think, Maybe I should just wait.
That may not be the best strategy either.
The latest numbers tell a much more nuanced story.
There were 566 new listings in July, but only 464 new pending sales. Closed sales also fell to 471 after an exceptionally strong 570 closings in June.
At the same time, homes that did sell moved quickly and prices remained strong.
To me, that signals a market becoming a little more selective.
Buyers have choices. They’re looking carefully. But when the right house comes along—one that’s well presented, appropriately priced and checks the right boxes—they’re still willing to compete for it.
And that’s an important distinction as we head toward fall.
Curious What Your Home Could Be Worth Right Now?
Countywide statistics are useful, but real estate is hyperlocal.
A $385,000 county median doesn’t tell you what a home in Lititz, Manheim Township, Millersville, Lancaster City—or even two different neighborhoods within the same school district—is worth.
Your location, condition, improvements, price range and recent comparable sales all influence your home’s market value.
If selling has been somewhere in the back of your mind, let’s take a look at the numbers for your specific home. A personalized market analysis can give you a much clearer picture of your options before you make any decisions.
How Buyers and Sellers Can Prepare for the Fall Market
We’re moving out of the traditional spring and summer selling season, but that doesn’t mean the opportunity disappears.
It means the strategy changes.
And whether you’re buying or selling, understanding that shift can put you in a much better position.
If You’re Thinking About Selling
Don’t assume you missed your window.
Summer may get the attention, but fall can bring serious buyers—people relocating, buyers who didn’t find the right house earlier in the year, and families whose plans aren’t dictated by the school calendar.
Pay attention to your competition.
With 681 active listings in July, buyers had more options than they did earlier this year. Before listing, we need to know exactly what else a buyer will see in your price range.
Price for today’s buyer.
Yes, sellers averaged 103.1% of original list price. But that doesn’t mean starting high is the best strategy. A compelling initial price can create urgency and competition rather than leaving your home sitting while buyers move on to the next one.
Presentation matters more when buyers have choices.
Cleaning, decluttering, minor repairs, curb appeal, professional photography and thoughtful presentation aren’t simply cosmetic. They’re part of your marketing strategy.
Go to My Home Sellers Section for Additional Information
If You’re Thinking About Buying
Enjoy having more options—but don’t mistake options for unlimited time.
Active inventory increased, yet homes averaged only 16 days on market.
Get prepared before you find “the one.”
Know your financing, comfortable monthly payment and priorities before touring homes. Preparation gives you the ability to make a confident decision instead of an emotional one.
Look at each property individually.
Some homes may still receive multiple offers. Others may sit longer and create opportunities for negotiation. Don’t use one strategy for every house.
That’s where having someone who understands what’s happening at the neighborhood and price-point level becomes particularly important.
Go to My Home Buying Section for Additional Information
Follow the Lancaster County Market With Me
One month of statistics gives us a snapshot. Looking at several months together gives us a much better story.
Earlier this year, we watched Lancaster County move from limited winter inventory into a highly competitive spring market. By June, the median sold price had climbed to $385,000, closed sales surged, and sellers averaged more than 104% of original list price.
Now, the latest July numbers show the next evolution: inventory expanded, prices held, homes sold even faster, but pending and closed sales moderated from June.
If you’ve been following the series, catch up on the previous market updates:
- February 2026: Lancaster County Market Shifts as Spring Approaches
- March 2026: Lancaster County’s Spring Market Is Officially Heating Up
- April 2026: Lancaster County’s Spring Market Springs Forward
- May 2026: Lancaster County’s Summer Market Takes Shape
- June 2026: Lancaster County’s Summer Housing Market Set the Stage for a Strong Fall
Thinking About Making a Move This Fall?
The latest Lancaster County statistics don’t tell me that the market is suddenly becoming “good” or “bad.”
They tell me it’s changing.
Buyers have more choices. Sellers continue to benefit from strong home values. And homes that buyers want are still moving remarkably quickly.
That makes strategy more important—not less.
Whether you’re considering selling, downsizing, buying your first home, moving into something larger or simply wondering what your current home may be worth, you don’t need to make a decision based on a headline.
You need to know what the market means for you.
If a move could be part of your plans this fall or beyond, reach out. Let’s look at your goals, your neighborhood and the actual numbers and create a plan that makes sense for your next move

back to blog home


